Distributed Tracing
Track software performance, measure throughput & latency, and see the impact of errors across multiple systems with distributed tracing.
Distributed tracing provides a connected view of your application from frontend to backend. It helps track software performance, measure metrics like throughput and latency, and display the impact of errors across multiple systems. This makes Sentry a more complete performance monitoring solution, aiding in diagnosing problems and measuring your application's overall health. Tracing in Sentry provides insights such as:
- What occurred for a specific error event or issue
- Conditions causing bottlenecks or latency issues
- Endpoints or operations consuming the most time
Tracing is not profiling. While both diagnose application problems, they differ in what they measure and how data is recorded.
A profiler measures various aspects of an application's operation, resulting in a statistical summary. A tracing tool focuses on what happened (and when), logging events during a program's execution across multiple systems. Traces often include timestamps, allowing durations to be calculated, but their purpose is broader, showing how interconnected systems interact and how problems in one can affect another.
Learn more in this Tracing: Frontend issues with backend solutions workshop.
Applications consist of interconnected components or services. For example, a modern web application may include:
- Frontend (Single-Page Application)
- Backend (REST API)
- Task Queue
- Database Server
- Cron Job Scheduler
Each component can be instrumented individually using a Sentry SDK to capture error data or crash reports, but this doesn't provide the full picture. Tracing ties all the data together.
Tracing allows you to follow a request from the frontend to the backend and back, pulling in data from any background tasks or notification jobs that request creates. This helps correlate Sentry error reports and gain insights into which services may negatively impact your application's performance.
A trace represents the record of the entire operation you want to measure or track, like page load or a user action. When a trace includes work in multiple services, it's called a distributed trace.
Each trace consists of one or more tree-like structures called transactions, with nodes called spans. Each transaction represents a single instance of a service being called, and each span represents a single unit of work. Here's an example trace, broken down into transactions and spans:
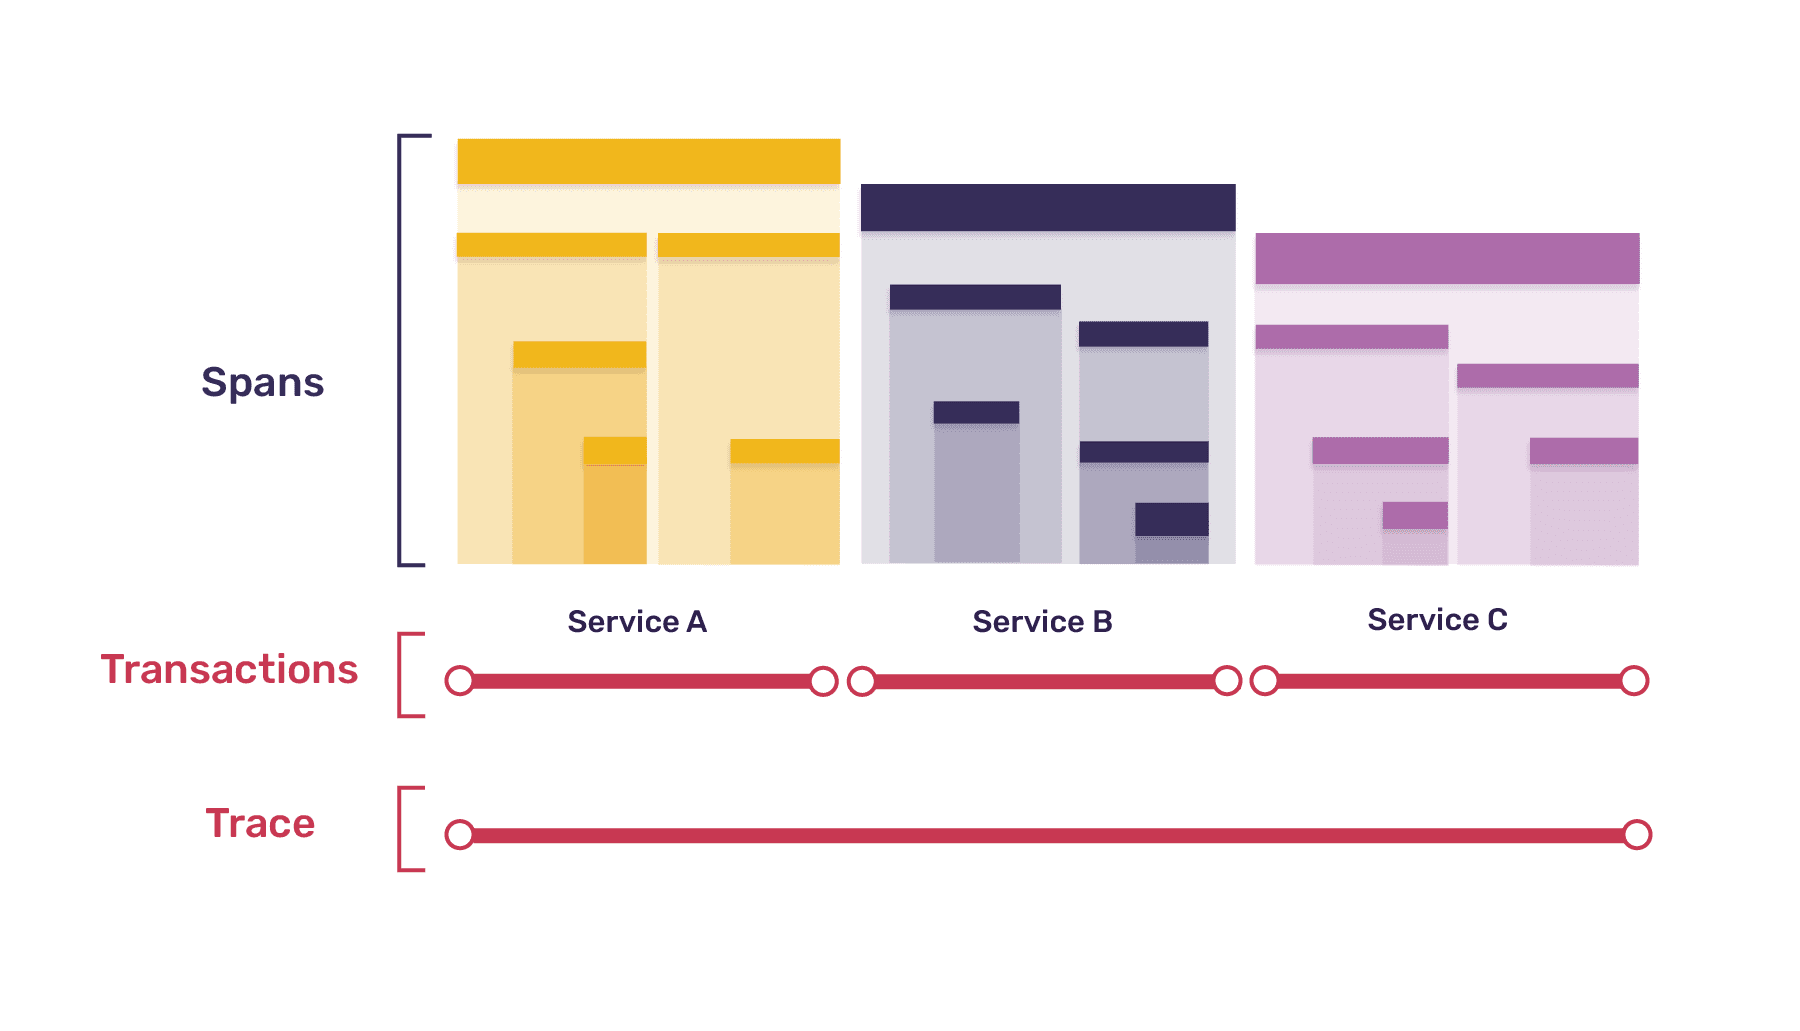
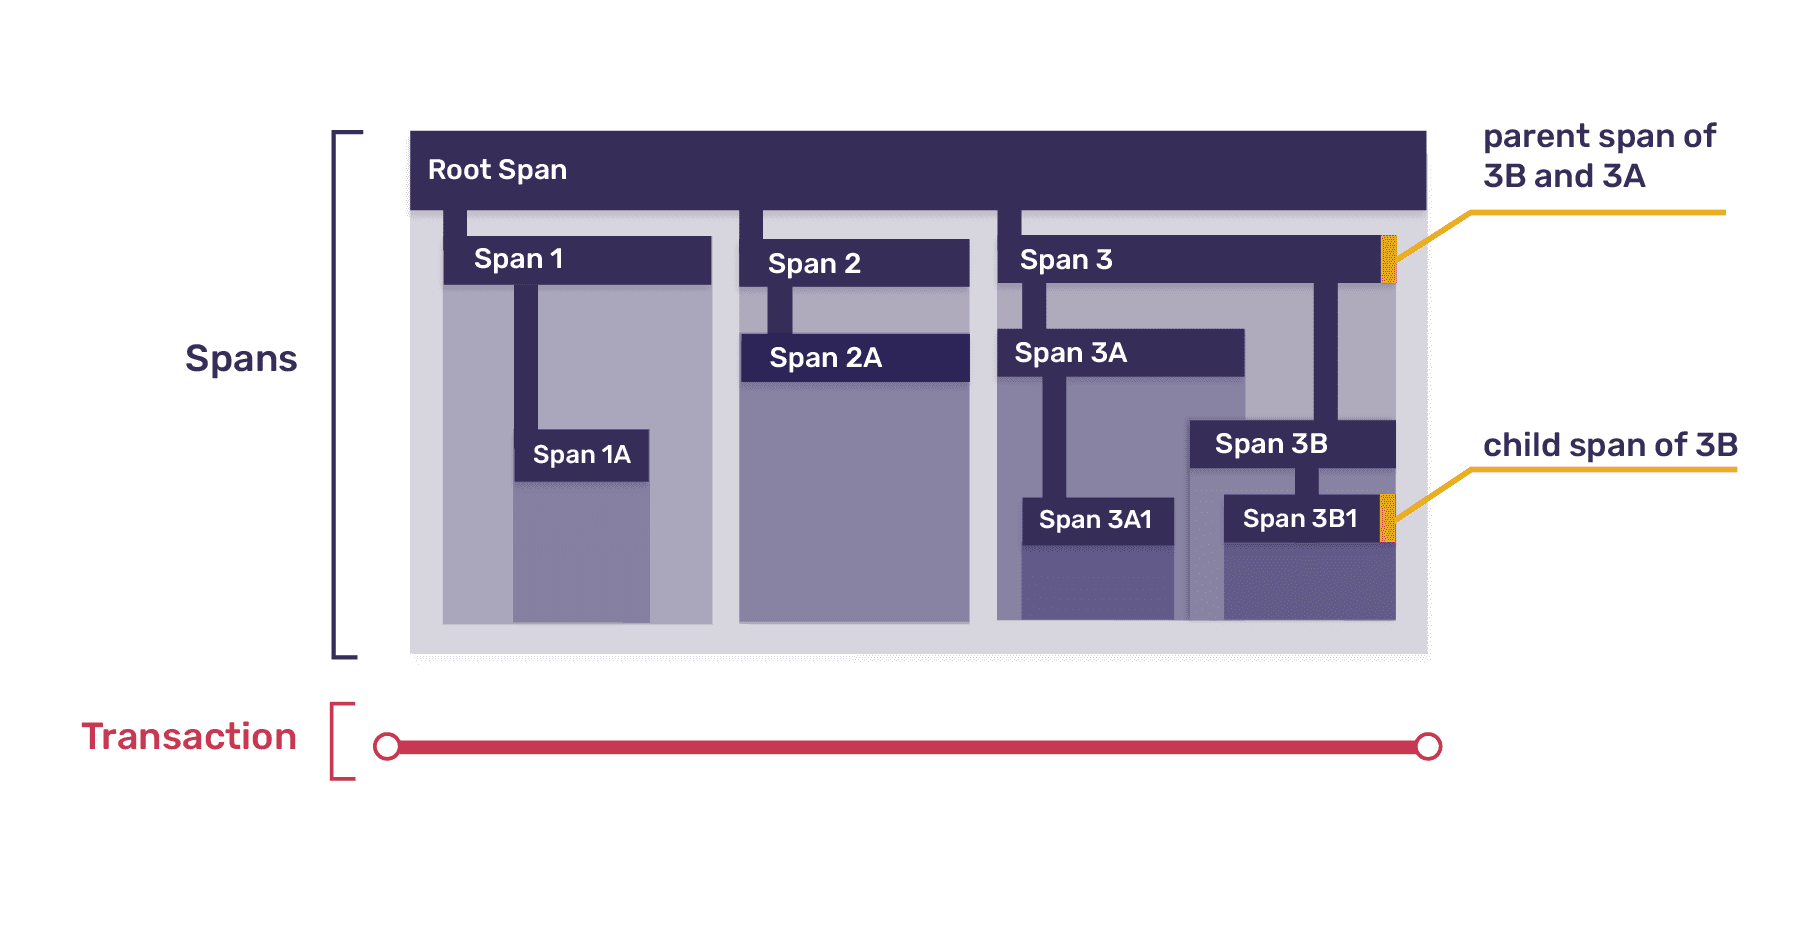
Top-level spans can be broken down into smaller spans, mirroring the way one function may call others. Every span may be the parent span to multiple child spans. One span in every transaction represents the transaction itself, with all other spans descending from that root span. Here's a zoomed-in view of one of the transactions from the diagram above:
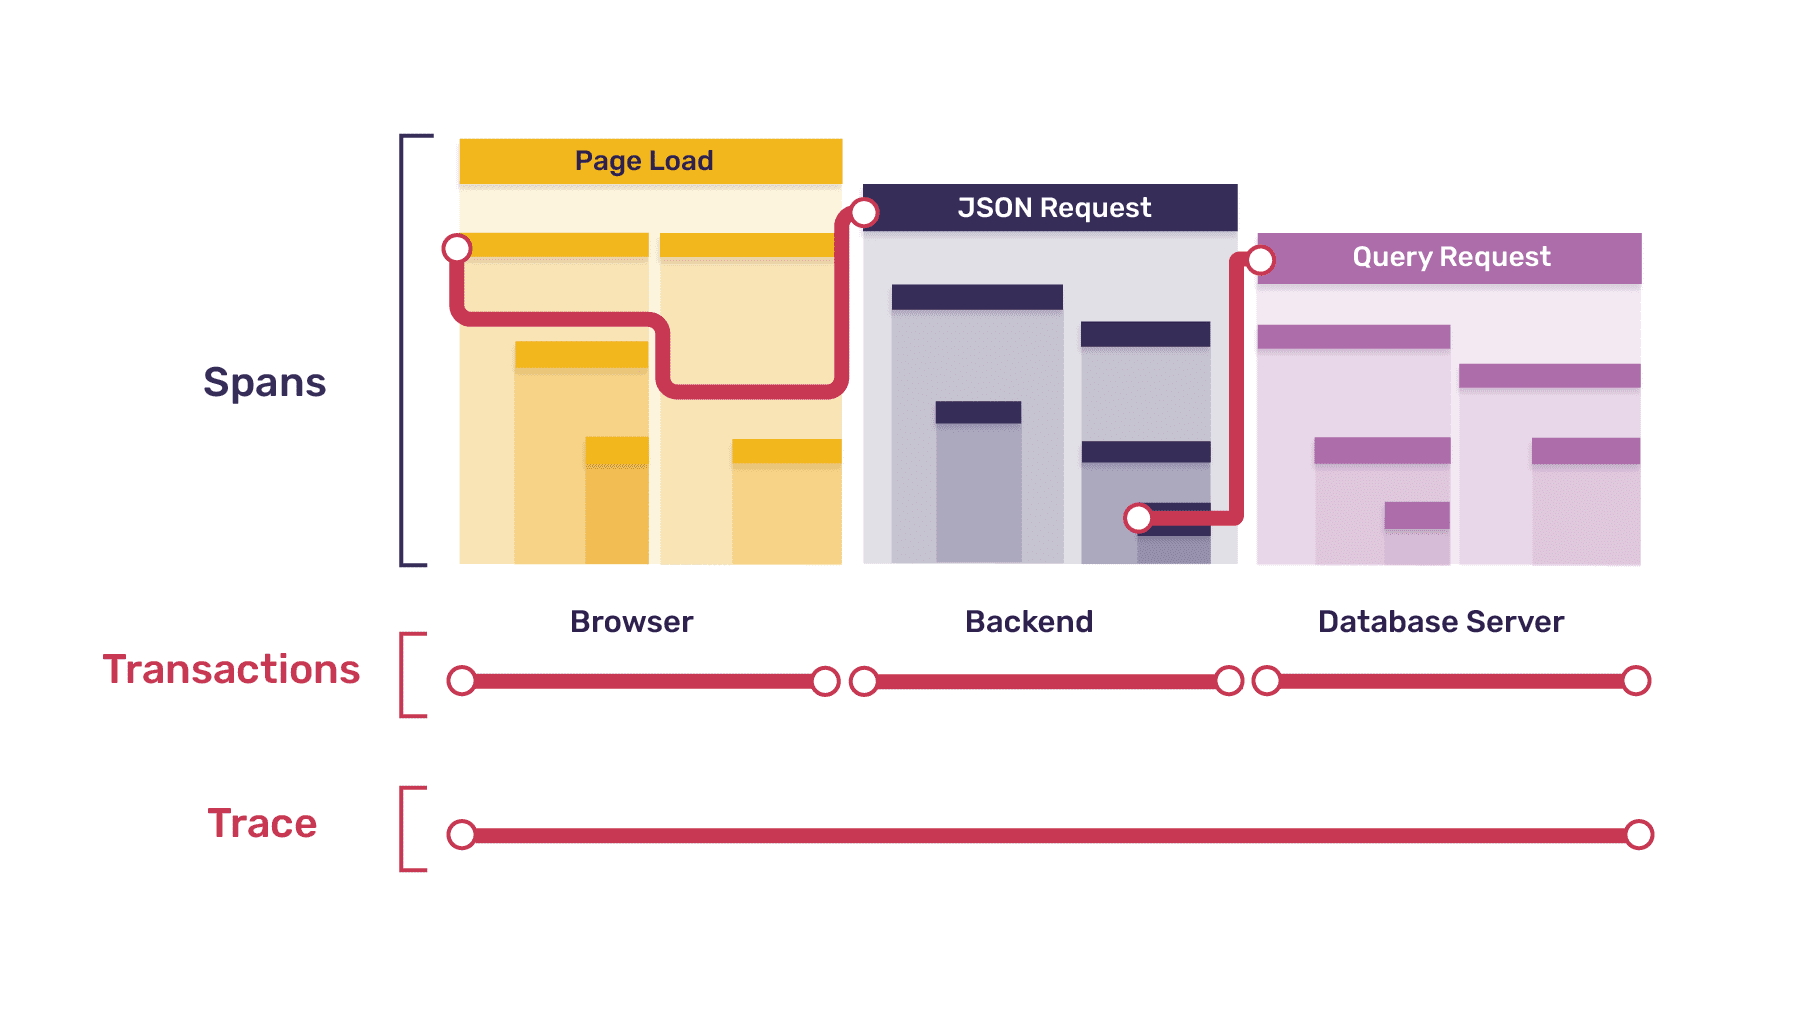
Suppose your web application is slow to load. A lot has to happen for your app to get to a usable state: multiple requests to your backend, calls to your database or external APIs, and browser processing. Which part is slowing things down?
In this simplified example, when a user loads the app in their browser, the following happens:
- Browser
- 1 request each for HTML, CSS, and JavaScript
- 1 rendering task, which sets off 2 requests for JSON data
- Backend
- 3 requests to serve static files (HTML, CSS, JS)
- 2 requests for JSON data - 1 requiring a database call, 1 requiring an external API call and processing
- Database Server
- 1 request requiring 2 queries (authentication and data retrieval)
Note: The external API is not listed as it's external and can't be seen inside.
The entire page-loading process is represented by a single trace. That trace consists of the following transactions:
- 1 browser transaction (for page load)
- 5 backend transactions (one for each request)
- 1 database server transaction (for the single DB request)
Each transaction is broken down into spans:
- Browser Page-load Transaction: 7 spans
- 1 root span for the entire page load
- 1 span each (3 total) for HTML, CSS, and JS requests
- 1 span for the rendering task, containing 2 child spans for each JSON request
Some spans in the browser transaction correspond to backend transactions. When a span in one service gives rise to a transaction in another, the original span is a parent span to both the transaction and its root span. In the diagram below, squiggly lines represent this parent-child relationship.
In our example, every transaction other than the initial browser page-load transaction is the child of a span in another service. In a fully-instrumented system, this pattern always holds true. The only parentless span is the root of the initial transaction; every other span has a parent. Parents and children live in the same service, except when the child span is the root of a child transaction, in which case the parent span lives in the calling service and the child transaction/child root span lives in the called service.
A fully-instrumented system creates a trace which is a connected tree, with each transaction a subtree. The boundaries between subtrees/transactions are the boundaries between services. The diagram above shows one branch of our example's full trace tree.
Now, back to our spans:
- Backend HTML/CSS/JS Request Transactions: 1 span each
- 1 root span for the entire request (child of a browser span)
- Backend Request with DB Call Transaction: 2 spans
- 1 root span for the entire request (child of a browser span)
- 1 span for querying the database (parent of the database server transaction)
- Backend Request with API Call Transaction: 3 spans
- 1 root span for the entire request (child of a browser span)
- 1 span for the API request (not a parent span, as the API is external)
- 1 span for processing the API data
- Database Server Request Transaction: 3 spans
- 1 root span for the entire request (child of the backend span above)
- 1 span for the authentication query
- 1 span for the data retrieval query
After instrumenting all services, you might discover that the auth query in your database server is causing the slowdown. Tracing can't tell you why it's happening, but now you know where to look!
For an e-commerce application, you might measure the time between a user clicking "Submit Order" and the order confirmation appearing. This process is one trace, with transactions (T) and spans (S) for:
- Browser's full process (T and root span S)
- XHR request to backend* (S)
- Rendering confirmation screen (S)
- Backend's processing of the request (T and root span S)
- Function call to compute total (S)
- DB call to store order* (S)
- API call to payment processor (S)
- Queuing of email confirmation* (S)
- Database's work updating the customer's order history (T and root span S)
- Individual SQL queries (S)
- Queued task of sending the email (T and root span S)
- Function call to populate email template (S)
- API call to email-sending service (S)
* Starred spans are parents of later transactions (and their root spans).
For a backend periodically polling for data from an external service, processing it, caching it, and forwarding it to an internal service, each instance is a trace, with transactions (T) and spans (S) for:
- Cron job completing the entire process (T and root span S)
- API call to external service (S)
- Processing function (S)
- Call to caching service* (S)
- API call to internal service* (S)
- Work done in your caching service (T and root span S)
- Checking cache for existing data (S)
- Storing new data in cache (S)
- Internal service's processing of the request (T and root span S)
- Handling the request (S)
* Starred spans are parents of later transactions (and their root spans).
"Show me your flowchart and conceal your tables, and I shall continue to be mystified. Show me your tables, and I won't usually need your flowchart; it'll be obvious."
-- Fred Brooks, The Mythical Man Month (1975)
Ultimately, any data structure is defined by the kind of data it contains, and relationships between data structures are defined by how links between them are recorded. Traces, transactions, and spans are no different.
Traces are defined as the collection of all transactions that share a trace_id value.
Transactions share most properties (start and end time, tags, etc.) with their root spans. They also have a transaction_name property, used in the UI to identify the transaction. Common examples include endpoint paths for backend request transactions, task names for cron job transactions, and URLs for page-load transactions.
Transaction names can contain sensitive data. See Scrubbing Sensitive Data for more information.
Before the transaction is sent, the tags and data properties merge with data from the global scope. (Global scope data is set in Sentry.init() or by using Sentry.configureScope(), Sentry.setTag(), Sentry.setUser(), and Sentry.setExtra().)
Span data includes:
parent_span_id: ties the span to its parent spanop: short string identifying the type or category of operation the span is measuringstart_timestamp: when the span was openedend_timestamp: when the span was closeddescription: longer description of the span's operationstatus: short code indicating operation's statustags: key-value pairs holding additional data about the spandata: arbitrarily-structured additional data about the span
An example use of the op and description properties together is op: db.query and description: SELECT * FROM users WHERE last_active < %s. The status property indicates the success or failure of the span's operation, or a response code for HTTP requests. Tags and data attach further contextual information to the span, such as function: middleware.auth.is_authenticated for a function call or request: {url: ..., headers: ... , body: ...} for an HTTP request. To search span data see Searchable Properties
A trace begins when the earliest transaction starts and ends when the latest transaction ends. You can't "start" or "end" a trace, but you can initiate a transaction which triggers a trace. Completing all transactions ends a trace.
Child transactions may outlive the transactions containing their parent spans. For example, if a backend API call sets off a long-running task and then immediately returns a response, the backend transaction will finish long before the async task transaction does. Asynchronicity means the order in which transactions are sent to Sentry doesn't depend on the order they were created. However, order of receipt for transactions in the same trace is correlated with order of completion.
In a fully instrumented system, each trace should contain only one transaction and one span (the transaction's root) without a parent. However, you may not have tracing enabled in every service, or an instrumented service may fail to report a transaction. This can result in gaps in your trace hierarchy, with non-originating, parentless transactions called orphan transactions.
There's no set limit to how deep the nesting of spans can go, but practical limits exist: transaction payloads sent to Sentry have a maximum allowed size, and there's a balance between data granularity and usability.
A span can have equal start and end times, recorded as taking no time. This can occur if the span is used as a marker or if the operation's duration is less than the measurement resolution.
Collecting transactions from multiple machines may result in clock skew, where timestamps in one transaction don't align with timestamps in another. To reduce this, use Network Time Protocol (NTP) or your cloud provider's clock synchronization services.
Individual spans aren't sent to Sentry; the entire transaction is sent as one unit. No span data is recorded by Sentry's servers until the transaction is closed and dispatched. Transactions are still valid and sent even if they only contain their root span.
When you enable sampling, you choose a percentage of collected transactions to send to Sentry. For example, a sampling rate of 0.25 for an endpoint receiving 1000 requests per minute results in approximately 250 transactions being sent to Sentry each minute. Sampling helps manage the number of events sent to Sentry and balance performance and volume concerns with data accuracy.
Sentry uses a "head-based" approach: a sampling decision is made in the originating service and passed to subsequent services. For example, if a browser makes requests to your backend, it includes the sampling decision in the headers. The backend collects transaction and span data if the decision is "yes" and passes the decision to subsequent services. This ensures either all transactions for a given trace are collected, or none are.
Dynamic sampling ensures complete traces by retaining all transactions associated with a trace if the head transaction is preserved. However, transactions or other items may still be missing from a trace when rate limiting or quota enforcement drops them.
Use the Trace Explorer to search for traces containing spans that meet your specific query conditions. This helps you find distributed traces that give you a connected view of your application and can help you debug and optimize your code.
Through Performance and Discover, you can also view trace data in the Trace View page.
Our documentation is open source and available on GitHub. Your contributions are welcome, whether fixing a typo (drat!) or suggesting an update ("yeah, this would be better").